How to Videos
Welcome to GIROUX's how-to video library, designed to help you make the most of your platform.
For new users, we suggest exploring the Basics tag initially. These videos are designed to equip you with skills needed to get you up and running quickly on the platform.
For additional help or new video suggestions get in touch
Contact Support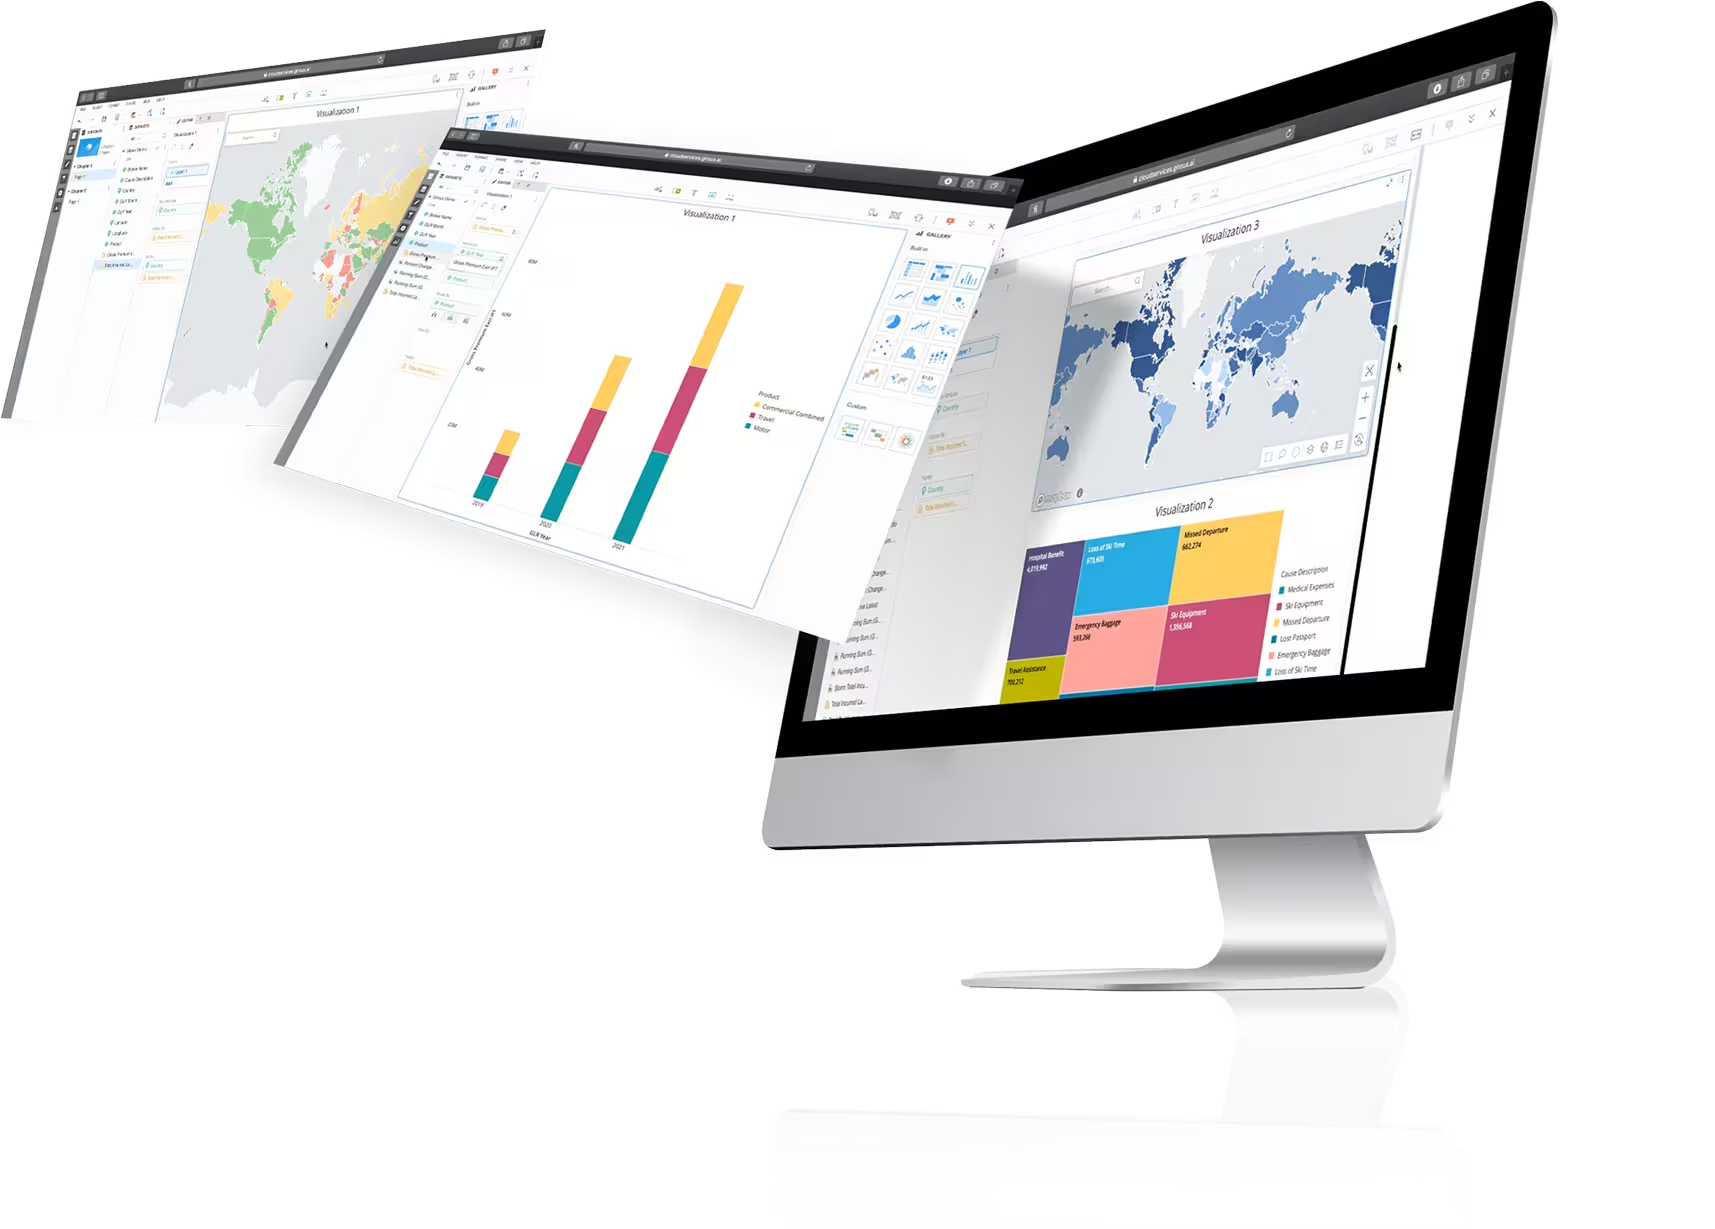
Simply click on a tag below, for example Dossier, to bring up all the how-to videos on that topic. You can also explore more detailed themes by using the secondary tags, for example you may want to dive deeper into Visualisations or Filtering.
Dossier - Basics Walkthrough
Walkthrough of the basic features of the dossier
Dossier - Basics Walkthrough
Dossier - Filter - Chapter and Page
How to filter chapter and pages within your dossier
Dossier - Filter - Chapter and Page
Dossier - Filter - Select Targets
How to create dynamic dossiers where clicking one visualisation filters other visualisations
Dossier - Filter - Select Targets
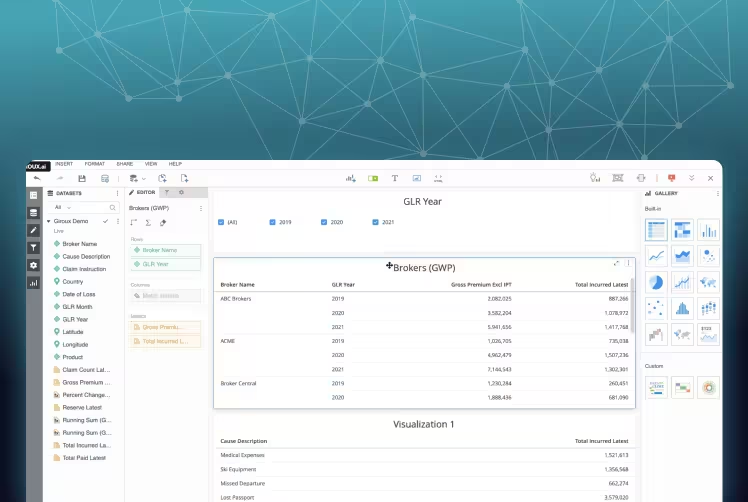
Dossier - Filter - Within Visualisation e.g. Top 20
How to embed filters into visualisations, e.g. creating a visualisation that only shows the top 20 brokers by premium.
Dossier - Filter - Within Visualisation e.g. Top 20
Dossier - Grid - Advanced
Advanced features to enhance your grid reports
Dossier - Grid - Advanced
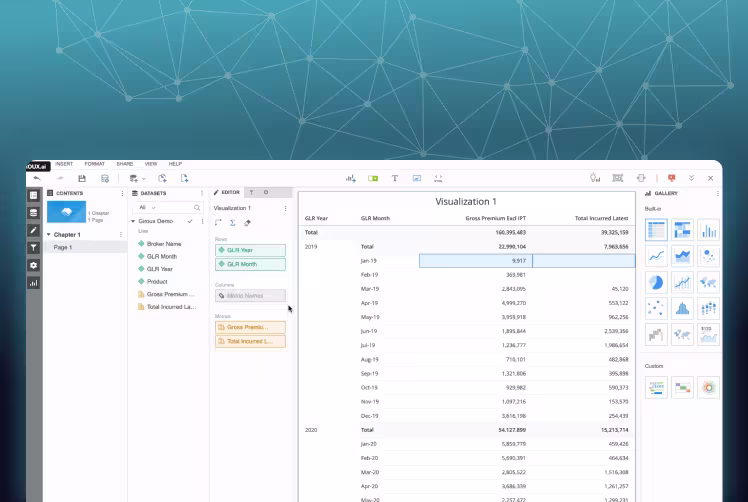
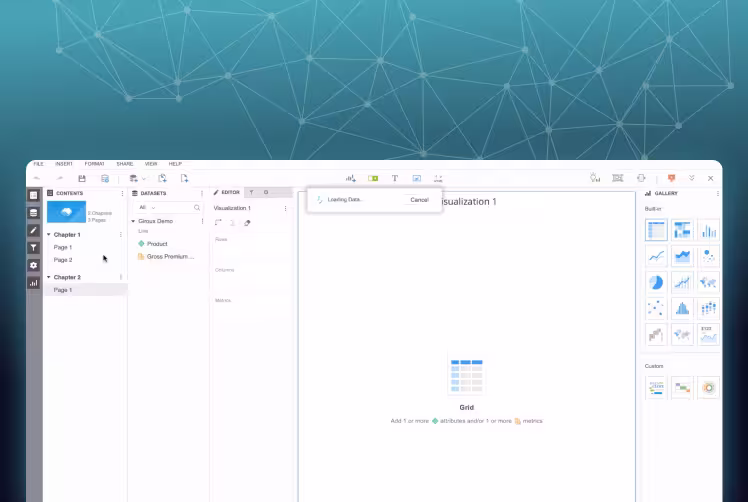
Dossier - Grid - Basics
The basics of the grid report
Dossier - Grid - Basics

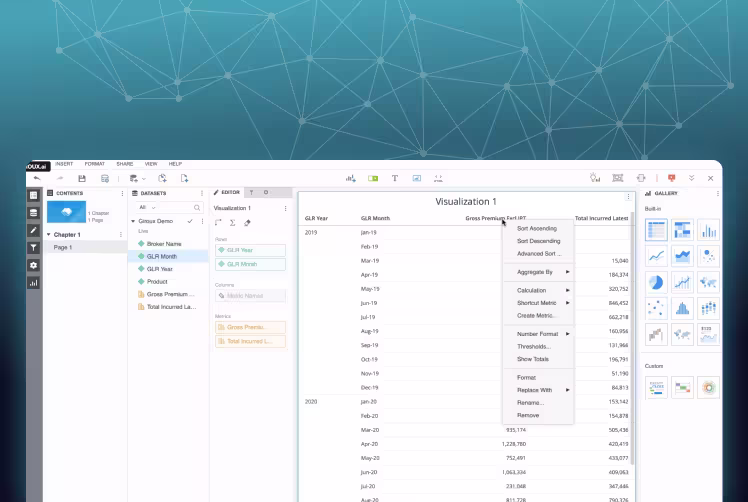
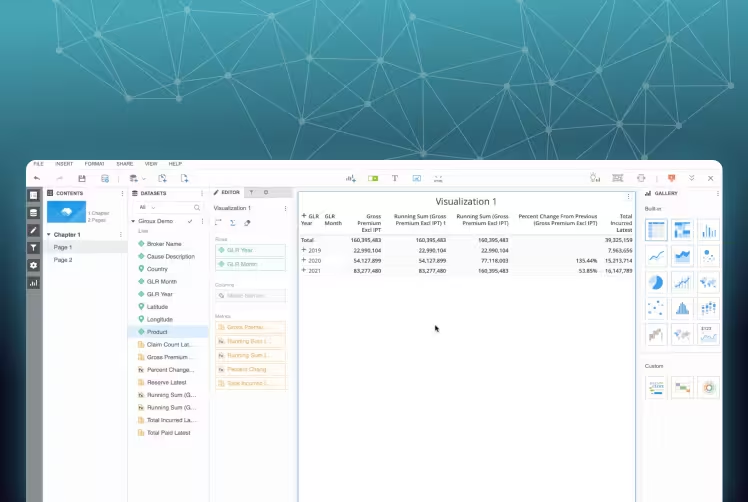
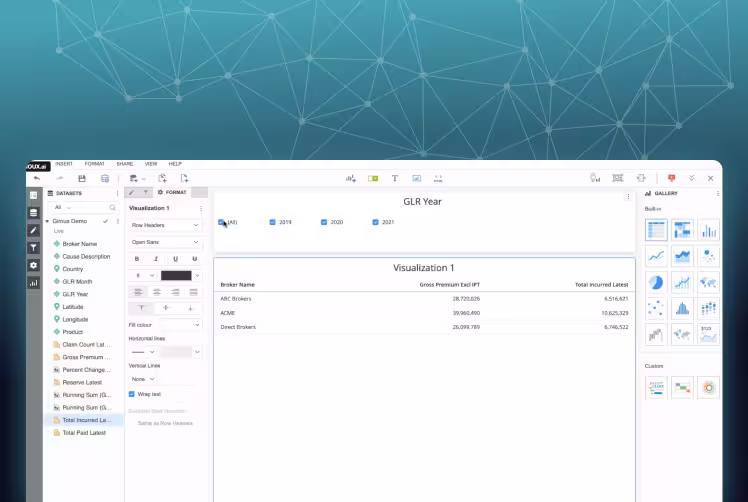
Dossier - Metrics - Create Metrics, Shortcut Metrics and Thresholds
Demonstrating creating new metrics, shortcut metrics, such as Percentage Change or Running Sum as well as applying thresholds to your data.
Dossier - Metrics - Create Metrics, Shortcut Metrics and Thresholds
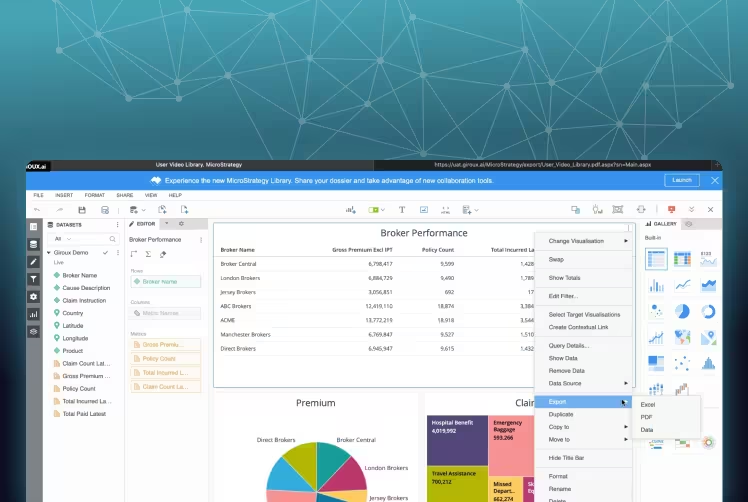
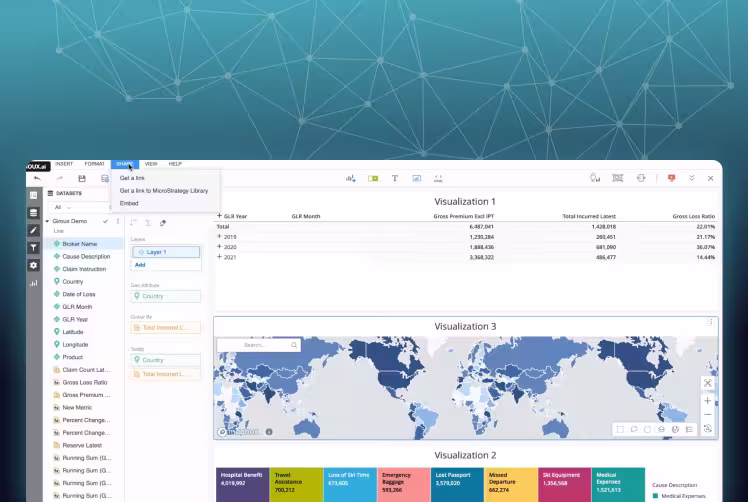
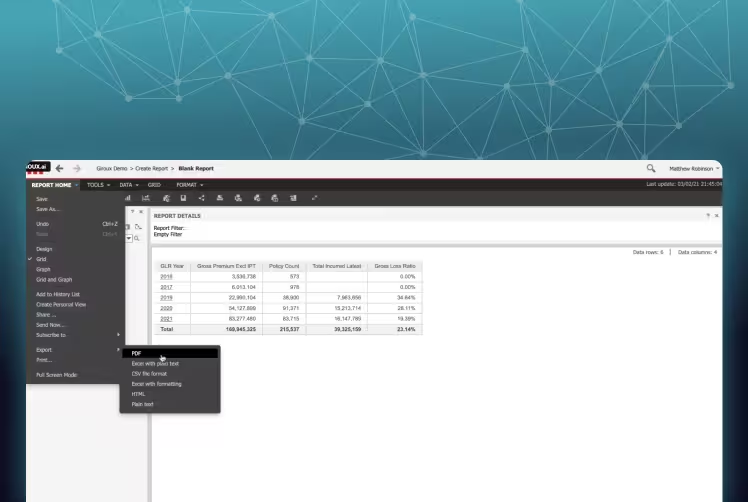
Dossier - Share - Export to PDF and Excel
How to export your dossier or visualisations to PDF and Excel
Dossier - Share - Export to PDF and Excel
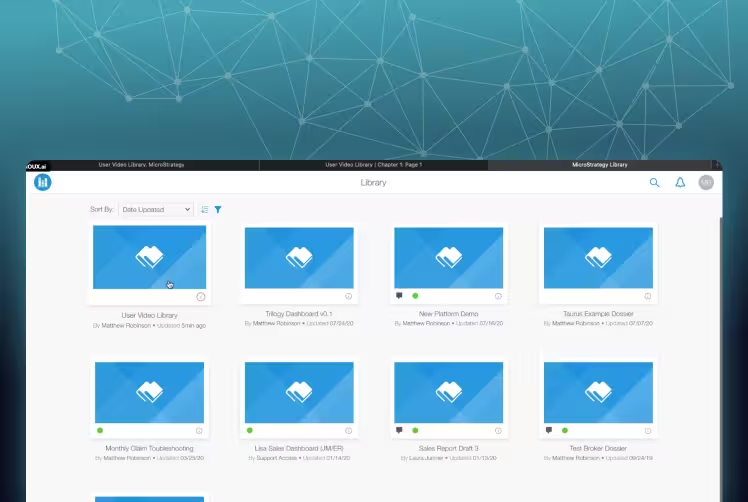
Dossier - Share - Library
How to add your dossier to Library and collaborate with ease with team members.
Dossier - Share - Library
Dossier - Share - Mobile
How to access your dossiers from a mobile device
Dossier - Share - Mobile
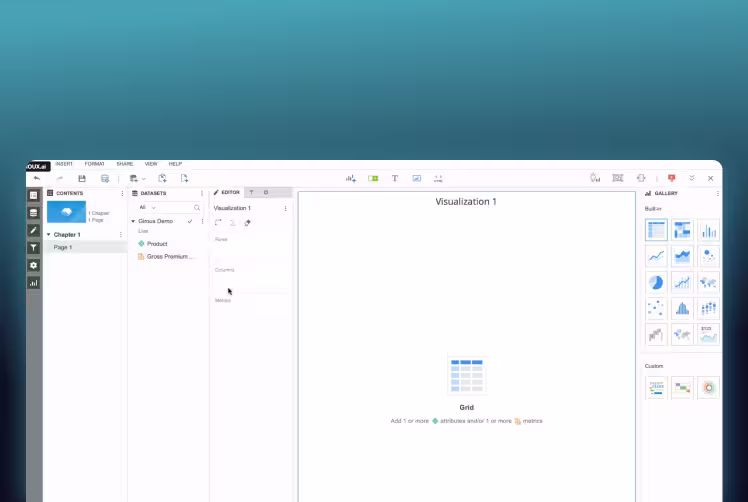
Dossier - Starting A New Dossier
Walkthrough of how to start a new dossier and add data to it
Dossier - Starting A New Dossier
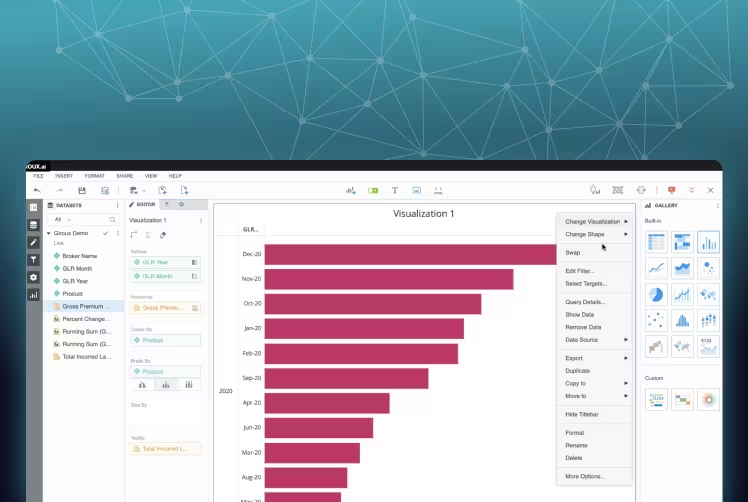
Dossier - Visualisation - Bar Chart
Features of the Bar Chart visualisation
Dossier - Visualisation - Bar Chart
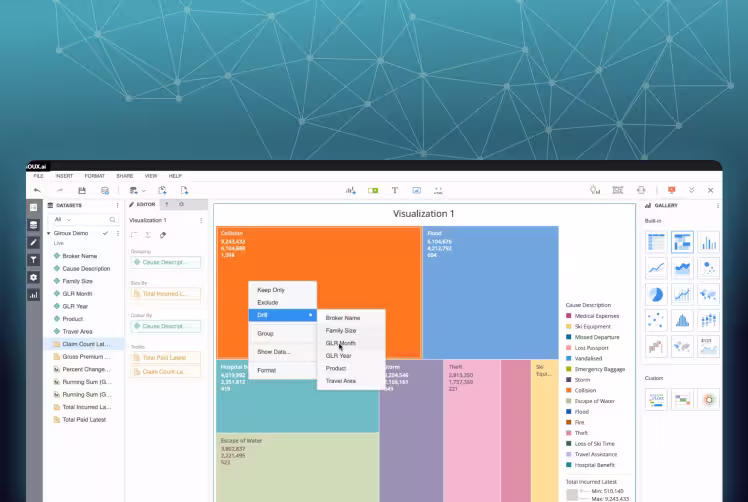
Dossier - Visualisation - Heatmap
Features of the Heat Map visualisation
Dossier - Visualisation - Heatmap
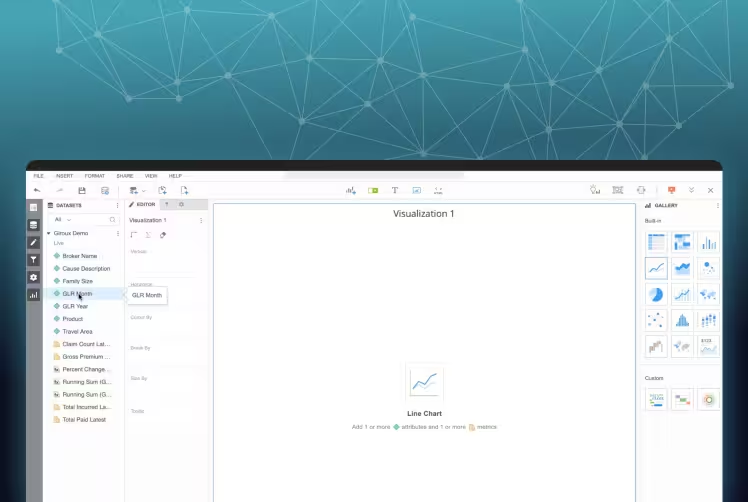
Dossier - Visualisation - Line Graph
Features of the Line Graph visualisation
Dossier - Visualisation - Line Graph
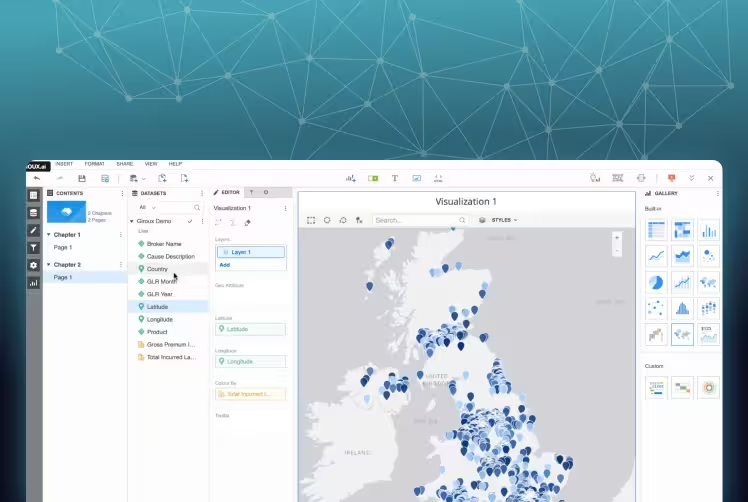
Dossier - Visualisation - Map
Features of the Map visualisation, including global and specific locations
Dossier - Visualisation - Map
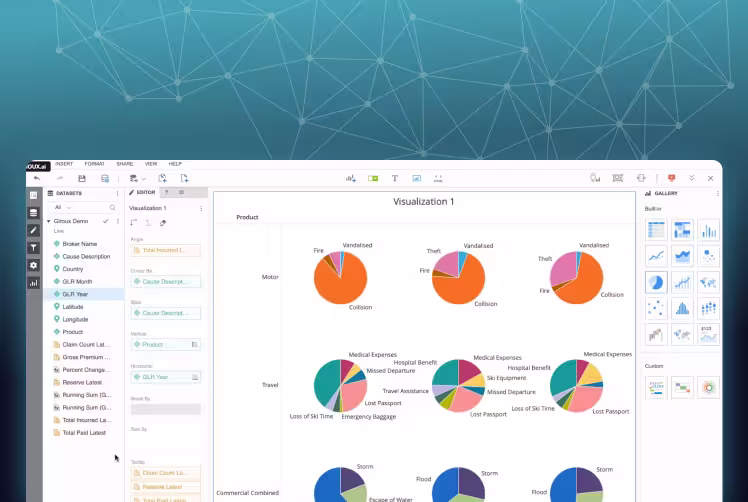
Dossier - Visualisation - Pie Chart
Features of the Pie Chart visualisation
Dossier - Visualisation - Pie Chart
Dossier - Visualisation - Trend
Features of the Trend visualisation
Dossier - Visualisation - Trend
Report - Basic Walkthrough
Walkthrough of the basic features of the dossier
Report - Basic Walkthrough
.avif)
How to Raise a Planner Ticket
How to Raise a Planner Ticket
How to Raise a Ticket
How to raise a ticket on the GIROUX data analytics platform
How to Raise a Ticket
Transform the way you underwrite.
Start your FREE trial today.
If you’re interested in learning more about how we can help you to save time and increase profits, input your details below and we will get back to you within one business day.
Thank you! Your submission has been received!
Oops! Something went wrong while submitting the form.
All content copyright © 2007 - 2023